

an702: SCM7B Frequency and Time Response
Application Note
Figures 1 through 4 are the result of performing a 100-run Monte Carlo analysis on the SCM7B filter circuitry in both the frequency and time domains.* In this
type of analysis, all component values are simultaneously (and randomly) varied between the specified ± tolerances. 100 runs ensures an adequate statistical
sample. Although the circuit bandwidth used is 3Hz, the results can be extended to higher bandwidths by appropriate scaling.
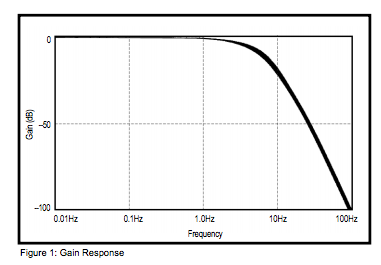
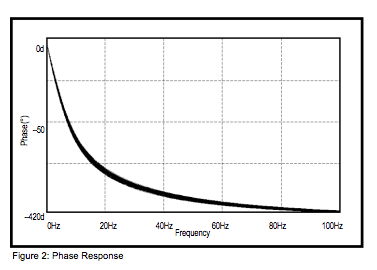
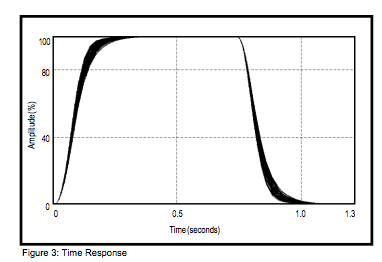
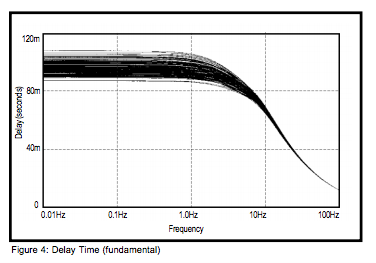
*Model represented: SCM7B34-02D
*Model represented: SCM7B34-02D
Was this content helpful?
Thank you for your feedback!