


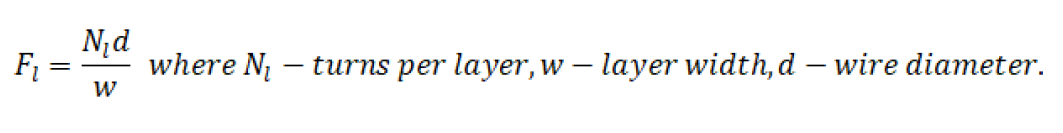
Eddy Current - Skin, and Proximity Effects
Tech Note
History
Francois Arago (1786-1853) observed magnetization of rotating conductors.Michael Faraday (1791-1867) explained this with his famous law of magnetic induction producing circulating electric current within a rotating body. [2]
Heinrich Lenz (1804-1865) stated his law that induced AC current will flow in a direction producing a magnetic field opposing that of the source field, a requirement of the conservation of energy.
Leon Foucault (1819-1868) discovered eddy currents produce heat when a permanent magnetic is placed at the edge of a rotating metal disk.
David E. Hughes (1831-1900) is believed to have used the eddy current principle to sort metals in 1879, the first practical use.
Faraday’s Law
Faraday’s law and Lenz’s law are fundamental to understanding magnetic phenomena. The minus sign is stated with Faraday’s law to show Lenz’s law.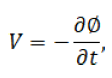
where Ø is magnetic flux in Webers. The unit of Flux density is Teslas = Webers per square meter. In this paper B represents flux density.
Eddy Current and Skin Effect
Eddy current results from changing magnetic fields within a conductor. Skin Effect results from circulating eddy currents, arising from a changing B field, cancelling the current flow in the center of a conductor and reinforcing it in the skin.This reduces the effective cross sectional area increasing wire resistance and losses. Using the right hand rule (thumb in direction of current and fingers will follow the magnetic field) simplified sketches 1A and 1B illustrate field and current directions. In essence the metal of the conductor works like a shorted secondary transformer within itself.
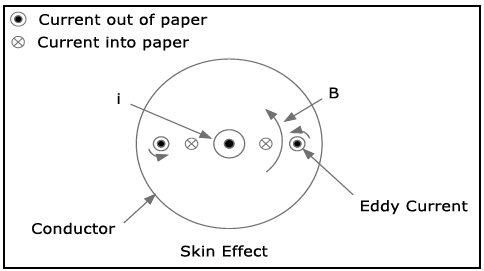
Figure 1A
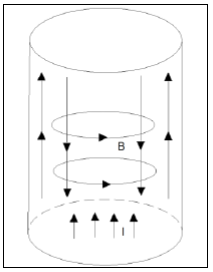
Figure 1B
The skin effect figure 1A shows a current i coming out of the page. By the right hand rule it induces the magnetic field B. The four small circles represent eddy currents circulating within the conductor. By Lenz’s law they induce opposing fields indicated by the small curved arrows. At the outside edge of the conductor the eddy currents tend to enforce the main current. The eddy currents flowing into the page oppose the current. Thus the conductor current tends to concentrate toward the outer edge of the conductor’s cross section. A rigorous analysis shows that current density decreases exponentially moving in from the outer edge. The skin depth is defined as the 1/e point along the radius of the conductor cross section. For the purpose of computing an AC resistance to current, this choice for skin depth also means the skin depth annular ring’s cross sectional area may be considered to carry all of the current evenly distributed. The effective cross section becomes the annular ring formed by r and (r – Sd) for Sd < r. For commonly used frequencies this follows closely the following relation for skin depth, Sd.
For copper,

Thus,
As frequency approaches zero, skin depth approaches infinity, as it must for DC current to be equally distributed in a uniform conductor.
The ratio of AC to DC resistance is a useful concept.
Consideration and analysis of applications with this ratio reveal that large wires for high frequencies are not useful. It may be better to parallel smaller wires. Litz wire may be used to minimize skin and proximity effects; however, this wire is difficult to use and terminate.
It must also be noted that rectangular wave drive has higher harmonics making losses even greater. Table 7.7 of [1] gives estimates of Rac/Rdc for 25, 50, 100, and 200kHz for rectangular wave shapes with even wire sizes from #12 to #34. That table is reproduced in Table 1 below.
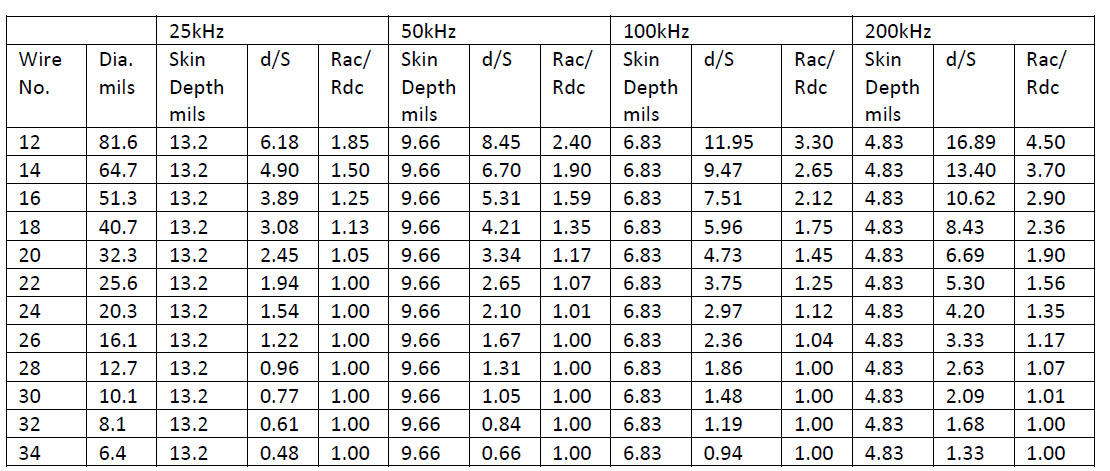
Table 1
Proximity Effect
For transformers, the proximity effect may be more detrimental than skin effect. The following sketch represents overlaid transformer windings.In Figure 2, the curved arrow B1 represents magnetic flux cause by i1. The upper pair of short arrows, using the right hand rule, represent eddy currents opposing B1. The planes of the curved arrows are perpendicular to the plane of the page. Lenz’s law requires the secondary current i2 to flow in a direction causing the B2 flux to oppose B1. The lower short arrows represent circulating eddy currents whose flux oppose B2. Eddy currents augment i1 and i2 on the facing edges of the overlaid conductors and oppose on the outer edges. Thus the effective cross section of the wires are reduced because current concentrates on the adjacent edges. The reduced effective cross section causes extra losses for a given power transmission.
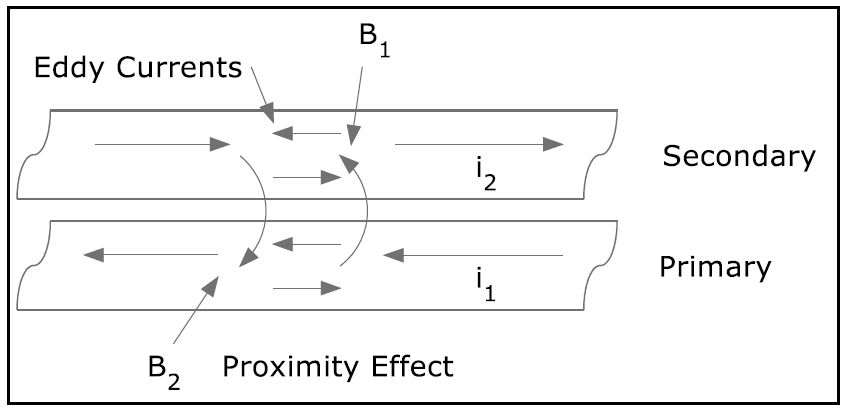
Figure 2
Dowell [3] curves combine the effects of skin effects and proximity effects providing an approximation to the Rac/Rdc ratio. Skin depth may be found with the Sd formula or Table 1. This combined with the Dowell curves reproduced in Pressman [1] Table 7.9, or in Figure 3, provide the desired AC to DC resistance in transformer windings.
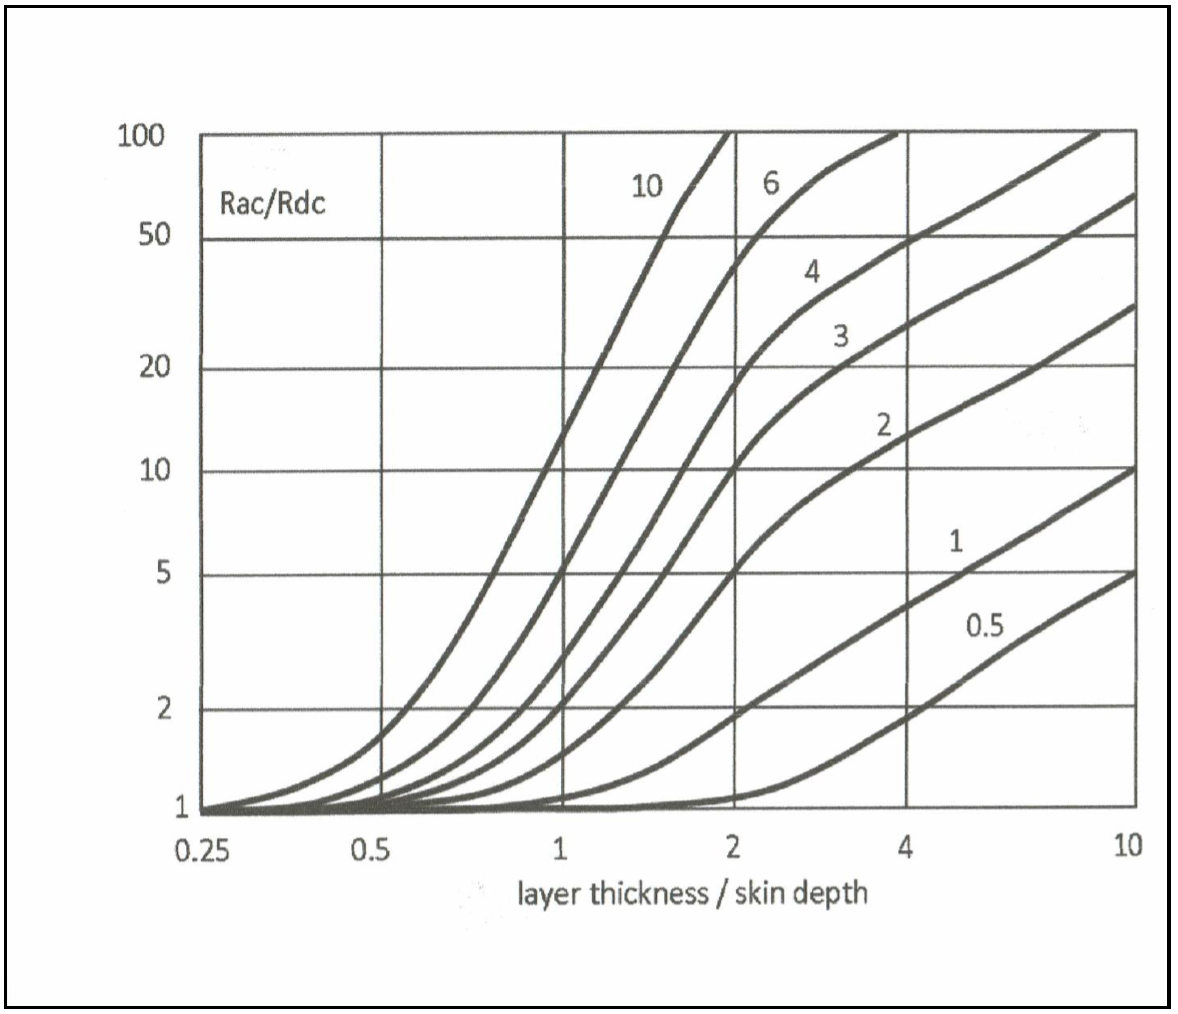
Figure 3
Figure 3 shows the ratio of FR = Rac/Rdc versus the following quantity. This figure is taken from Texas Instruments slup125 [6], Magnetics Design 3. The following expression calculates the entry for the horizontal axis.
Where the numerator is the effective layer thickness, 0.886 is the effective round wire height for diameter d, and Sd is the skin depth.
The above material, taken from Pressman [1] [4], is straight forward enough for single layer windings. For more layers the plot thickens. The numbers on the curves represent the layers per “portion.” Clever ways of interleaving primary and secondary windings can cut the AC resistance by more than half compared to a complete primary and a complete secondary wound over one another. Skin and proximity effects combined can increase the AC resistance from more than 10 times to as much as 100 times the DC resistance. AC resistance increases exponentially as the number of layers increases. The Dowel curves use a parameter p (the curve numbers) for “portion.” This is illustrated in Figure 4. Portion refers to a region of transition from zero to a maximum, low frequency, magnetomotive force (mmf). The top of the following figure shows two layers per portion. This would be p = 2 on the Dowell curves. For the lower, interleaved winding p = 1. The p variable refers to the numbers on the curves and represents layers per portion.
For example, if
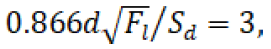 and p = 2, the Dowell curve gives an AC to DC resistance ratio of
approximately 9 to 1. With p = 1 the ratio is cut to 3, a 3 to 1 improvement.
and p = 2, the Dowell curve gives an AC to DC resistance ratio of
approximately 9 to 1. With p = 1 the ratio is cut to 3, a 3 to 1 improvement.
There are magnetic application programs that use Finite Element Analysis (FEA) tools to provide more accurate analysis of complex geometries. [5]
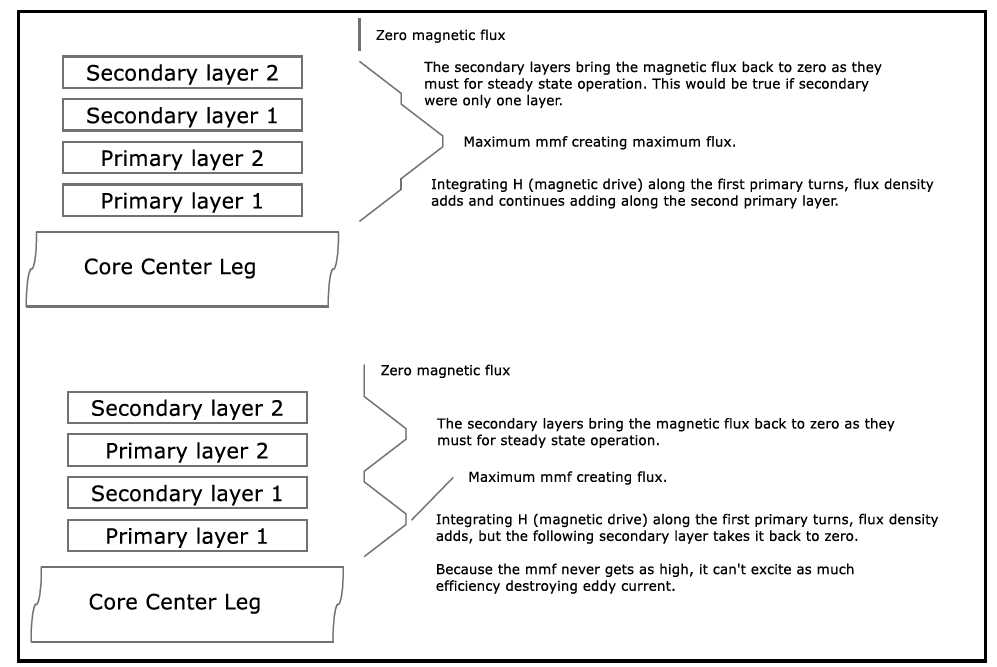
Figure 4
The proximity effect does not apply to flyback transformers as primary and secondary currents are not simultaneous. In some cases, it may be better to use finer wire and fewer layers, even when this increases DC resistance. This is all that can be done to help a flyback transformer. A close reading of Pressman [1] [4] section 7.5.6 is recommended. Two section bobbins could decrease proximity effects at the expense of a lower coupling coefficient.
References
- A. I. Pressman, Switching Power Supply Design, McGraw-Hill, 1998, 2nd edition.
- Wikipedia search terms: Eddy current, Skin effect, Proximity effect (electromagnetism), Permeability (electromagnetism), Electrical resistivity and conductivity.
- P. Dowell, “Effects of Eddy Currents in Transformer Windings,” Proceedings IEE (U.K.), 113(8): 1387-1394, 1966.
- A.I. Pressman, Keith Billings, Taylor Morey, Switching Power Supply Design, McGraw-Hill, 2009, 3rd edition.
- Envelope Power, Ansonia, Conn.
- Texas Instruments, Magnetic Design 3, slup125.
Related Content
Tech Note
Dataforth's library of Tech notes
Tech Note
Was this content helpful?
Thank you for your feedback!